
Anatomy of an AI agent incident
A short post on a string of related incidents we had a few months ago, and how we discovered and resolved the issues


As we launch our first Platform & Security Engineering role, we thought to follow in the footsteps of many great tech companies that have come before and write about a string of incidents that we worked through about six months ago. These were a wild ride for us!
It all started with a memory usage alert
At Gradient Labs, our platform and AI agent are written in Go and deployed using Cloud Run. Each conversation that our agent participates in is a long-running Temporal workflow which manages the conversation’s state, timers, and runs child workflows to generate responses. We have alerts across many of our platform and agent metrics, some of which page an on-call Engineer.
Late one weekend evening, Google Cloud platform alerts fired: the memory usage across our agent’s containers was abnormally high. This is a somewhat nebulous alert: it doesn’t mean we’re down, but it does mean that something is not quite right.
Our top priority is always to ensure that no customers are left hanging: i.e., that our agent is replying in all its active conversations. We raised an incident. We looked to quickly pinpoint any changes that started this pattern: there was nothing that immediately stood out. Notably, this was difficult to narrow down because, during the day, each deployment that we had been making was zeroing out the problem. And we were also dealing with variable traffic, having multiple trials running at that time. So we bought ourselves some time by redeploying the agent with more memory. The alert was resolved within minutes, but we knew that a deep investigation was required to get to a root cause.
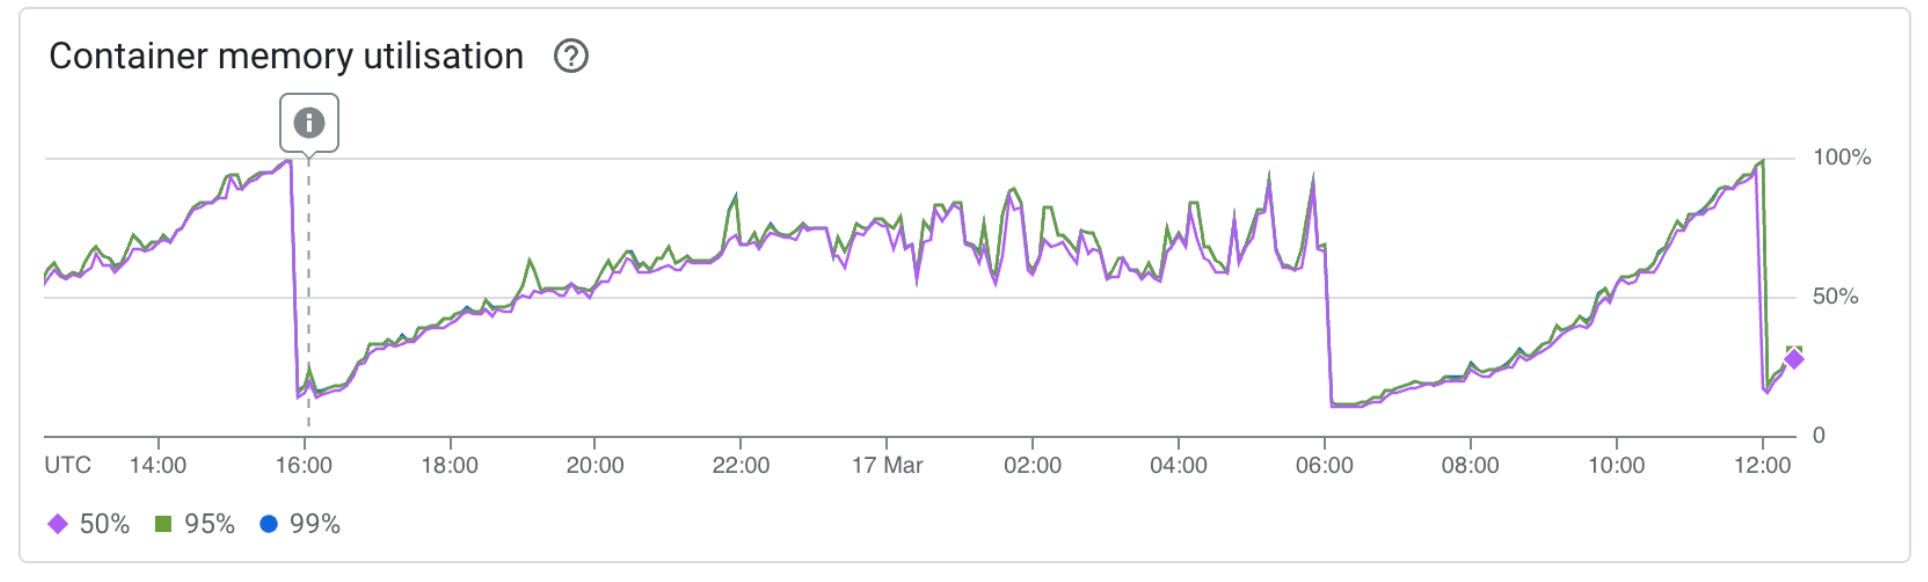
Diving into the metrics, this looked like a classic memory leak where our agent container kept restarting. The problem was that memory utilisation was growing much faster than before.
Spoiler: it wasn’t a memory leak
There are several different parts of our AI agent that we expect to be memory intensive, particularly parts that are operating with many (variably sized) documents. We also run different parts of the agent in parallel to speed it up. We revisited all of these to ensure that resources were not being left in memory when no longer in use. None of these turned up anything useful; it seemed that something below the surface was at play. Perhaps with Temporal?
When researching online, we found an odd post on the Temporal forum about an unexplained memory leak, but there wasn’t a clear answer there either. It seemed likely that if there was a memory leak in the Go Temporal SDK, that we wouldn’t be the only ones impacted. So we put it to one side, and kept digging.
The Google Cloud Profiler flame graphs deltas for our agent's memory usage finally shed some light. Temporal’s top-level execution functions had the biggest growth over time in exclusive memory: something they were doing was increasing memory usage, and it had nothing to do with any of the functions they called further down the call stack. Among other things, these top-level functions are responsible for adding items to the Temporal Workflow cache. This cache stores workflow execution histories so that they don't always need to be retrieved from Temporal Cloud when a workflow resumes. Could this be what is causing the problem? We set out to validate this by running some tests.
Validating & fixing the issue
To validate whether our problem was indeed related to the workflow cache, we made a sequence of intentional changes:
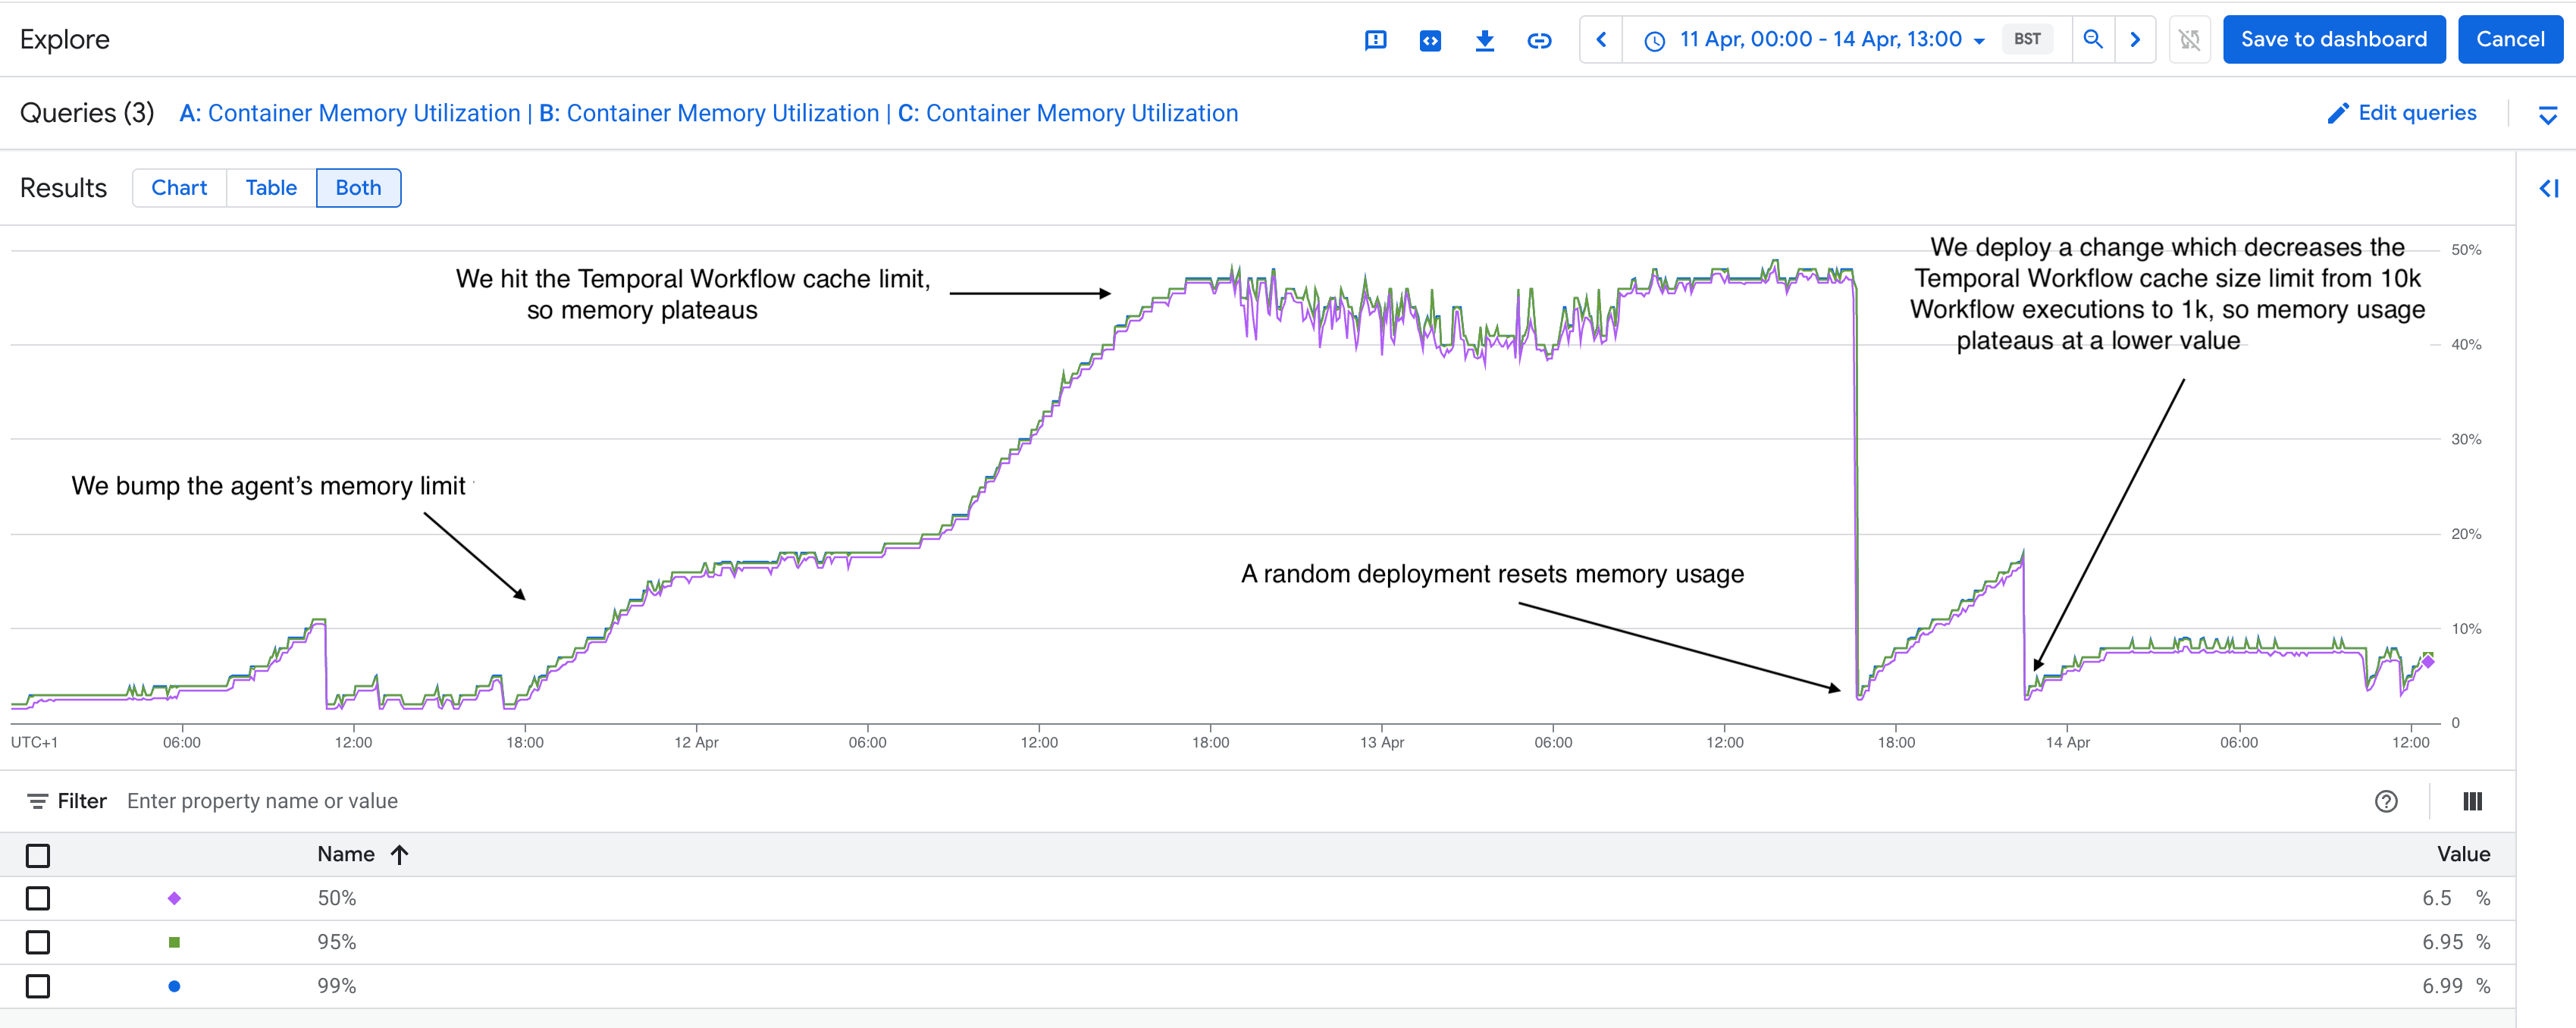
The first change was to boost the agent’s memory to 5x what it previously had. Memory usage continued to grow but eventually plateaued. There was some kind of limit that we had reached.
We then deployed a change to decrease the worker’s cache size down by 10x. The container’s memory continued to grow, but plateaued at a much lower value.
It seemed that we had found our answer: our previous container memory limit was below the cache’s “plateau” value: containers were crashing as the cache was trying to fill up.
We closed this out by tuning our worker cache size. This was a trade-off between: how much memory we need to provision for our instances (infrastructure cost) vs how large we could make the cache (which reduces network calls to Temporal Cloud, and thus overall latency). Back in business!
But wait... why is the AI agent slowing down?
A short while after, as we continued onboarding new customers (and increasing our overall volume of conversations) we spotted that our AI agent’s mean latency seemed to have increased. This measures the average time that it takes our AI agent to do all of the steps that it needs to do to generate and safeguard its replies—a slow down here makes for a slightly worse customer experience.
Usually, this is an early symptom that one of the many LLM model providers that we use might be about to declare an incident. On that day, that was indeed the case, and so we adjusted our LLM fail-over system and the mean latency started going back down.
The next day, the problem resurfaced. This time, however, there were no reported outages from LLM providers (and no other errors, like rate limits). Curiously, this apparent change in latency seemed to be across the board, spanning agent skills that used different model providers and prompts that were known to regularly run very quickly, for both simple and complex AI agent responses. The problem seemed to be proportional to the volume that we were currently handling, which does fluctuate over the course of the day.
Digging through our metrics, we identified that the issue was not with the LLM providers themselves: the problem was that the time between scheduling and starting to execute our Temporal activities had grown substantially (sometimes more than 10x), while our rate of executions had dropped. Something was bottlenecked.
Fixing a side-effect of the previous fix
Opening the Google Cloud dashboard, we quickly found the answer: our agent had scaled itself down to very few instances. By manually editing the minimum instance count, we saw an immediate uptick in activity executions and everything returned to normal. It took us less than an hour to identify and fix the problem.
How did this happen? Effectively, by auto-scaling our container count down, we had reduced our ability to execute activities. Most of them were scheduled, but then stuck waiting for an available worker to execute them—and there were far too few to execute them swiftly.
Cloud Run auto-scales, in both directions, and so originally we had been reliant on this and had set a low, non-zero minimum instance count. Importantly, it auto scales based on incoming HTTP requests, event consumption and CPU utilisation. Since our agent is a Temporal workflow, it had none of these: it polls Temporal Cloud (rather than receiving HTTP requests), it does not consume events, and the CPU utilisation had been fairly low. However, Cloud Run also attempts to gracefully handle cases where containers are crashing, which had stopped ever since we fixed the workflow cache problem 🤦. Effectively, Cloud Run had been keeping up with our instances crashes. By tuning the cache size, we fixed one problem but inadvertently prevented Cloud Run from scaling: we had throttled ourselves. A quick fix, but an unintended problem!
Exceptional customer service, from the platform up
Running an AI agent at scale means that we need to finely tune every single layer of our systems: the prompts, the LLM providers, the databases, and all the way through to the containers. Ultimately, the exceptional experience that we give each customer is the result of orchestrating all of these together, seamlessly.
In the incidents described above, we were all hands on deck to ensure that our AI agent was not abandoning any customers, and to get it back up on its feet as quickly as possible. As we keep rapidly scaling, this is an area that needs full-time attention: if these kinds of problems excite you, we are hiring for a Platform & Security Engineer.
 | A guest post by
|
Any specific reason why Gradient labs prefer Cloud run over GKE?
GKE provide better control for such type of workloads
Interesting write-up.
I recently started working with GCP Cloud Run. In your experience, have you had any need to SSH into the containers to run some commands? If so, how do you handle this?